How to attach debugger to .NET Compact Framework running on the mobile device emulator
Enable Managed debugging on the mobile device - by default it is disabled to not affect performance.
Run Visual Studio Remote Tools> Remote Registry Editor and choose the Mobile Device/Emulator
Add/Change following key in registry
Go to the :
HKEY_LOCAL_MACHINE/SOFTWARE/Microsoft/.NETCompactFramework/Managed Debugger/ and set the AttachEnabled value to 1
if the 'Managed Debugger' key does not exist just create it, the same with AttachEnabled value (new DWORD Value with name: AttachEnabled and value: 1)
In the Visual Studio go to Debug > Attach to Process
In the Transport choose Smart Device
Browse for your Device/Emulator
Choose the application and attach debugger ( if an application have been opended before making changes in the Device Registry you may have to restart the application )
Right now (if the symbols are loaded) you can start debugging application. Voila!
Showing posts with label Debugging. Show all posts
Showing posts with label Debugging. Show all posts
Friday, January 7, 2011

Eclipse conditional breakpoints
Here is how to set a conditional breakpoint in Eclipse IDE:
1) on the Debug perspective go to Breakpoints view
2) Right-click the breakpoint and choose "Breakpoint properties" (or select the breakpoint and press Alt+Enter)
3) On the properties window enable checkbox "Enable condition" and type a condition expression, breakpoint can be hit when condition becomes true or the condition value changes-it is all configurable.
That's all, although setting conditional breakpoint is not as intuitive as in Visual Studio, it works and does the job!
1) on the Debug perspective go to Breakpoints view
2) Right-click the breakpoint and choose "Breakpoint properties" (or select the breakpoint and press Alt+Enter)
3) On the properties window enable checkbox "Enable condition" and type a condition expression, breakpoint can be hit when condition becomes true or the condition value changes-it is all configurable.
That's all, although setting conditional breakpoint is not as intuitive as in Visual Studio, it works and does the job!
Thursday, April 23, 2009
Structured debugging process
Debugging should never be done chaotically. Below you can find instructions how to debug in a structured way.
- Duplicate the Bug
The most important, no repro no fix - Describe the Bug
Keep it in database – easier to track changes - Always assume that the Bug is yours
If bug is in your code you can fix it, if not = trouble; eliminate any possibility before looking elsewhere - Divide and conquer
Hypothesis and elimination, look into code, like a binary search. - Think creatively
Version mismatches, operating system differences, problems with program binaries or installations, external factors - Leverage Tools
Helps to investigate e.g. Error detection tools (invalid memory accesses, parameters to system APIs and COM interfaces) - Start Heavy Debugging
Much time on exploring program's operations - Verify that the Bug is fixed
Easy when isolated module, harder in critical code – verify for all data conditions, good and bad & regression. Changes to critical code => inform the team! - Learn and Share
Summarize what you have learned and share with colleagues – helps eliminate the bug faster.
Of course there is no need to follow all the steps. If the bug is found and fixed just go directly to the step no.8
The steps are taken from an excellent book "Debugging Applications for .Net and Microsoft Windows" by John Robbins.
Saturday, March 7, 2009
Logging information - Trace Class
What are Trace statements
Trace statements are essentially printf style debugging. It allows to debug without a debugger. This kind of debugging was used before interactive debuggers were used.
How to use Trace class
Trace objects are active only if TRACE is defined-by default TRACE is defined in debug and release build projects in Visual Studio.
Similarly as Debug object, the Trace object uses TraceListeners to handle output.
If log data need to be stored in some particular way a custom trace listener can be implemented e.g. if data should be stored in database.
By default all logging information goes to the Output window. Let's see how to use a non-default listener, in this example we will use TextWriterTraceListener class.
FileStream objStream = new FileStream("C:\\AppLog.txt", FileMode.OpenOrCreate);
TextWriterTraceListener objTraceListener = new TextWriterTraceListener(objStream);
Trace.Listeners.Add(objTraceListener);
Trace.WriteLine("This is first trace message");
Trace.WriteLine("This is second trace message");
Trace.Flush();
objStream.Close();
In first line a FileStream object is created with file mode set to open or create.
Next the TextWriterTraceListener object is initialized with FileStream object.
To make it work the listener has to be added to Listeners collection of Trace class. Next the WriteLine method is used to log two text messages and finally the buffer is flushed to the output and FileStream is closed.
Notice that the default trace listener was not removed from the collection so whatever will be written using Trace class methods will go to all listeners from the collection, in this case will go to the Output window and will be logged to the AppLog.txt file.
How to control Trace from outside of application
Trace class can be controlled from outside of an application. Furthermore the configuration can be modified without rebuilding the application.
In order to configure trace we have to add the App.config file to the project which is basically XML file. After building a project the App.config file will change name to ApplicationName.exe.config where ApplicationName is actual application's Assembly name.
Let's take a look at following example.
<?xml version="1.0" encoding="utf-8" ?>
<configuration>
    <system.diagnostics>
        <trace autoflush="true" indentsize="2">
            <listeners>
                <remove name="Default"/>
                <add name="EventLogListener" type="System.Diagnostics.EventLogTraceListener" initializeData="MyEventLog"/>
            </listeners>
        </trace>
    </system.diagnostics>
</configuration>
All trace configuration should be placed under node. In above example we set two trace properties, the flush and the indent size. Next the default listener is removed, so the Trace will not write anything to the Output window. Next line we add a new listener of the type of EventLogTraceListener with a name of EventLogListener and we set an event source name to MyEventLog. Without writing a single line of code we added a a non-default trace listener. Isn't that great?If above configuration is used you can find trace logs in the Event Viewer under Windows Logs/Application (click picture to enlarge).

How to use switches
Switches allow enabling or disabling tracing. In general there are two classes of switches BooleanSwitch (as name suggests has two possible states) and more interesting TraceSwitch class, which is basically multilevel switch with following possible levels
- Off
- Error
- Warnings
- Info
- Verbose
There are two things which need to be done in order to use switches
- Define TraceSwitch object
TraceSwitch theSwitch = new TraceSwitch("theSwitchName", "description");
The first parameter is very important and enables to control the switch from outside of application. Second parameter is a description.
- Set the switch level.
it can be done in the code e.g.
theSwitch.Level = TraceLevel.Info;
Or it can be configured from outside of application in already known config file, which is very useful since changes in configuration do not require rebuilding application!
<?xml version="1.0" encoding="utf-8" ?>
<configuration>
    <system.diagnostics>
        <switches>
            <add name="theSwitchName" value="3" />
        </switches>
    </system.diagnostics>
</configuration>
Possible values of trace levelTrace Level Value
- Off 0
- Error 1
- Warnings(& errors) 2
- Info(warnings & errors) 3
- Verbose (everything) 4
Trace.WriteLineIf(theSwitch.TraceError, "Error tracing is on!");
Trace.WriteLineIf(theSwitch.TraceWarning, "Warning tracing is on!");
Trace.WriteLineIf(theSwitch.TraceInfo, "Info tracing is on!");
Trace.WriteLineIf(theSwitch.TraceVerbose, "VerboseSwitching is on!");
To remove some some overhead we can use switch in a following way:
if ( theSwitch.TraceWarning )
{
    Trace.WriteLine( "Warning tracing is on!");
}
To use Trace statements in efficient manner we have to analyze how much information is needed to solve a problem on a machine without development environment. Too large log files will make process slow and on the other hand with too little information the problem cannot be solved.
Tuesday, March 3, 2009
Defensive programming – Assertions
What are Asserts?
Assertions are key component for proactive programming. If they are used in a correct way they tell where and why error happened.
Assertion declares that some condition must be true, if it is not, the assert fails, bringing up message on failed condition (screen shot below).
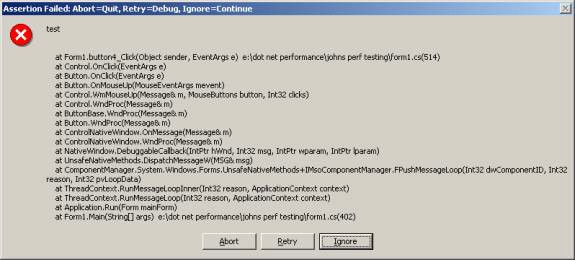
Asserts are used only on Debug builds ( the DEBUG must be defined - it is enabled by default in debug builds in Visual Studio )
If you will take a look in a retail build assembly using the .Net Reflector tool the Debug.Assert(...) code will not be in the assembly.
How to Assert?
There are two basic rules:
- Assert must not change values or state of program (treat as read only)
- Rule: Check a single item at a time.
What to Assert?
Generally you should use Asserts for:
- Parameters coming into method. Sometimes better approach is to throw InvalidArgumentException
- Values returned by methods; on wrong returned program may die after 20 minutes (Asserts help! )
- Use asserts when you need to check for assumption (e.g. Available memory )
How to use Asserts in .Net Framework
The Debug class is defined in System.Diagnostics namespace. The Debug class methods allows to print debugging information and check application logic with assertions, making more robust without impacting the performance and code size of retail assemblies.
The Debug class except of Assert method, in which we are the most interested, provides following write methods: Write, WriteIf, WriteLine and WriteLineIf.
Lets take a look at the Debug.Assert method, There are three overloaded versions of the method.
- Debug.Assert(i > 10);
- Debug.Assert(i > 10, "i > 10");
- Debug.Assert(i > 10, "i > 10", " i should be greater than 10, if you see this it means that it was not ;)");
- If assert is used in a similar way as below it does not tell us which parameter was bad
// wrong way to write assertion. Which param was bad?
public static void DoStuffWithObject1(int i, object o, int iLen)
{
    Debug.Assert((i > 0) && (null != o) && (iLen < MAXVAL ));
}
- And here is the right way of doing this
// right way to write assertion - every param individually
public static void DoStuffWithObject2(int i, object o, int iLen)
{
    Debug.Assert(i > 0);
    Debug.Assert(null != o);
    Debug.Assert(iLen < MAXVAL ));
    ...
}
- Asserts should check a value completely, in following example we expect that a parameter will be a valid customer name, what happens if an empty string is passed?
// incomplete checking
public static bool GetCustomerName(string CustName)
{
    Debug.Assert(null != CustName, "null != CustName");

    return true;
}
- And here example of complete checking
// complete checking
public static bool GetCustomerNameBetterChecking(string CustName)
{
    Debug.Assert(null != CustName, "null != CustName");
    Debug.Assert(0 != CustName.Length, "CustName is EmptyString");

    return true;
}
- Be careful because improper using of Asserts can crash application!
if the null is passed as a parameter the NullReferenceException is thrown
// Assert that crashes application if CustName is null
public static bool NullReferenceExceptionCrash(string CustName)
{
    Debug.Assert(CustName.Length > 0);

    return true;
}
Subscribe to:
Posts (Atom)


 Posts
Posts

